ReGraph
The React SDK for state-driven graph visualization
Build high-performing, interactive network and link analysis apps.
Designed specifically for React, ReGraph keeps your visualizations responsive at scale, so developers can focus on delivering insight from connected data.
Explore our SDK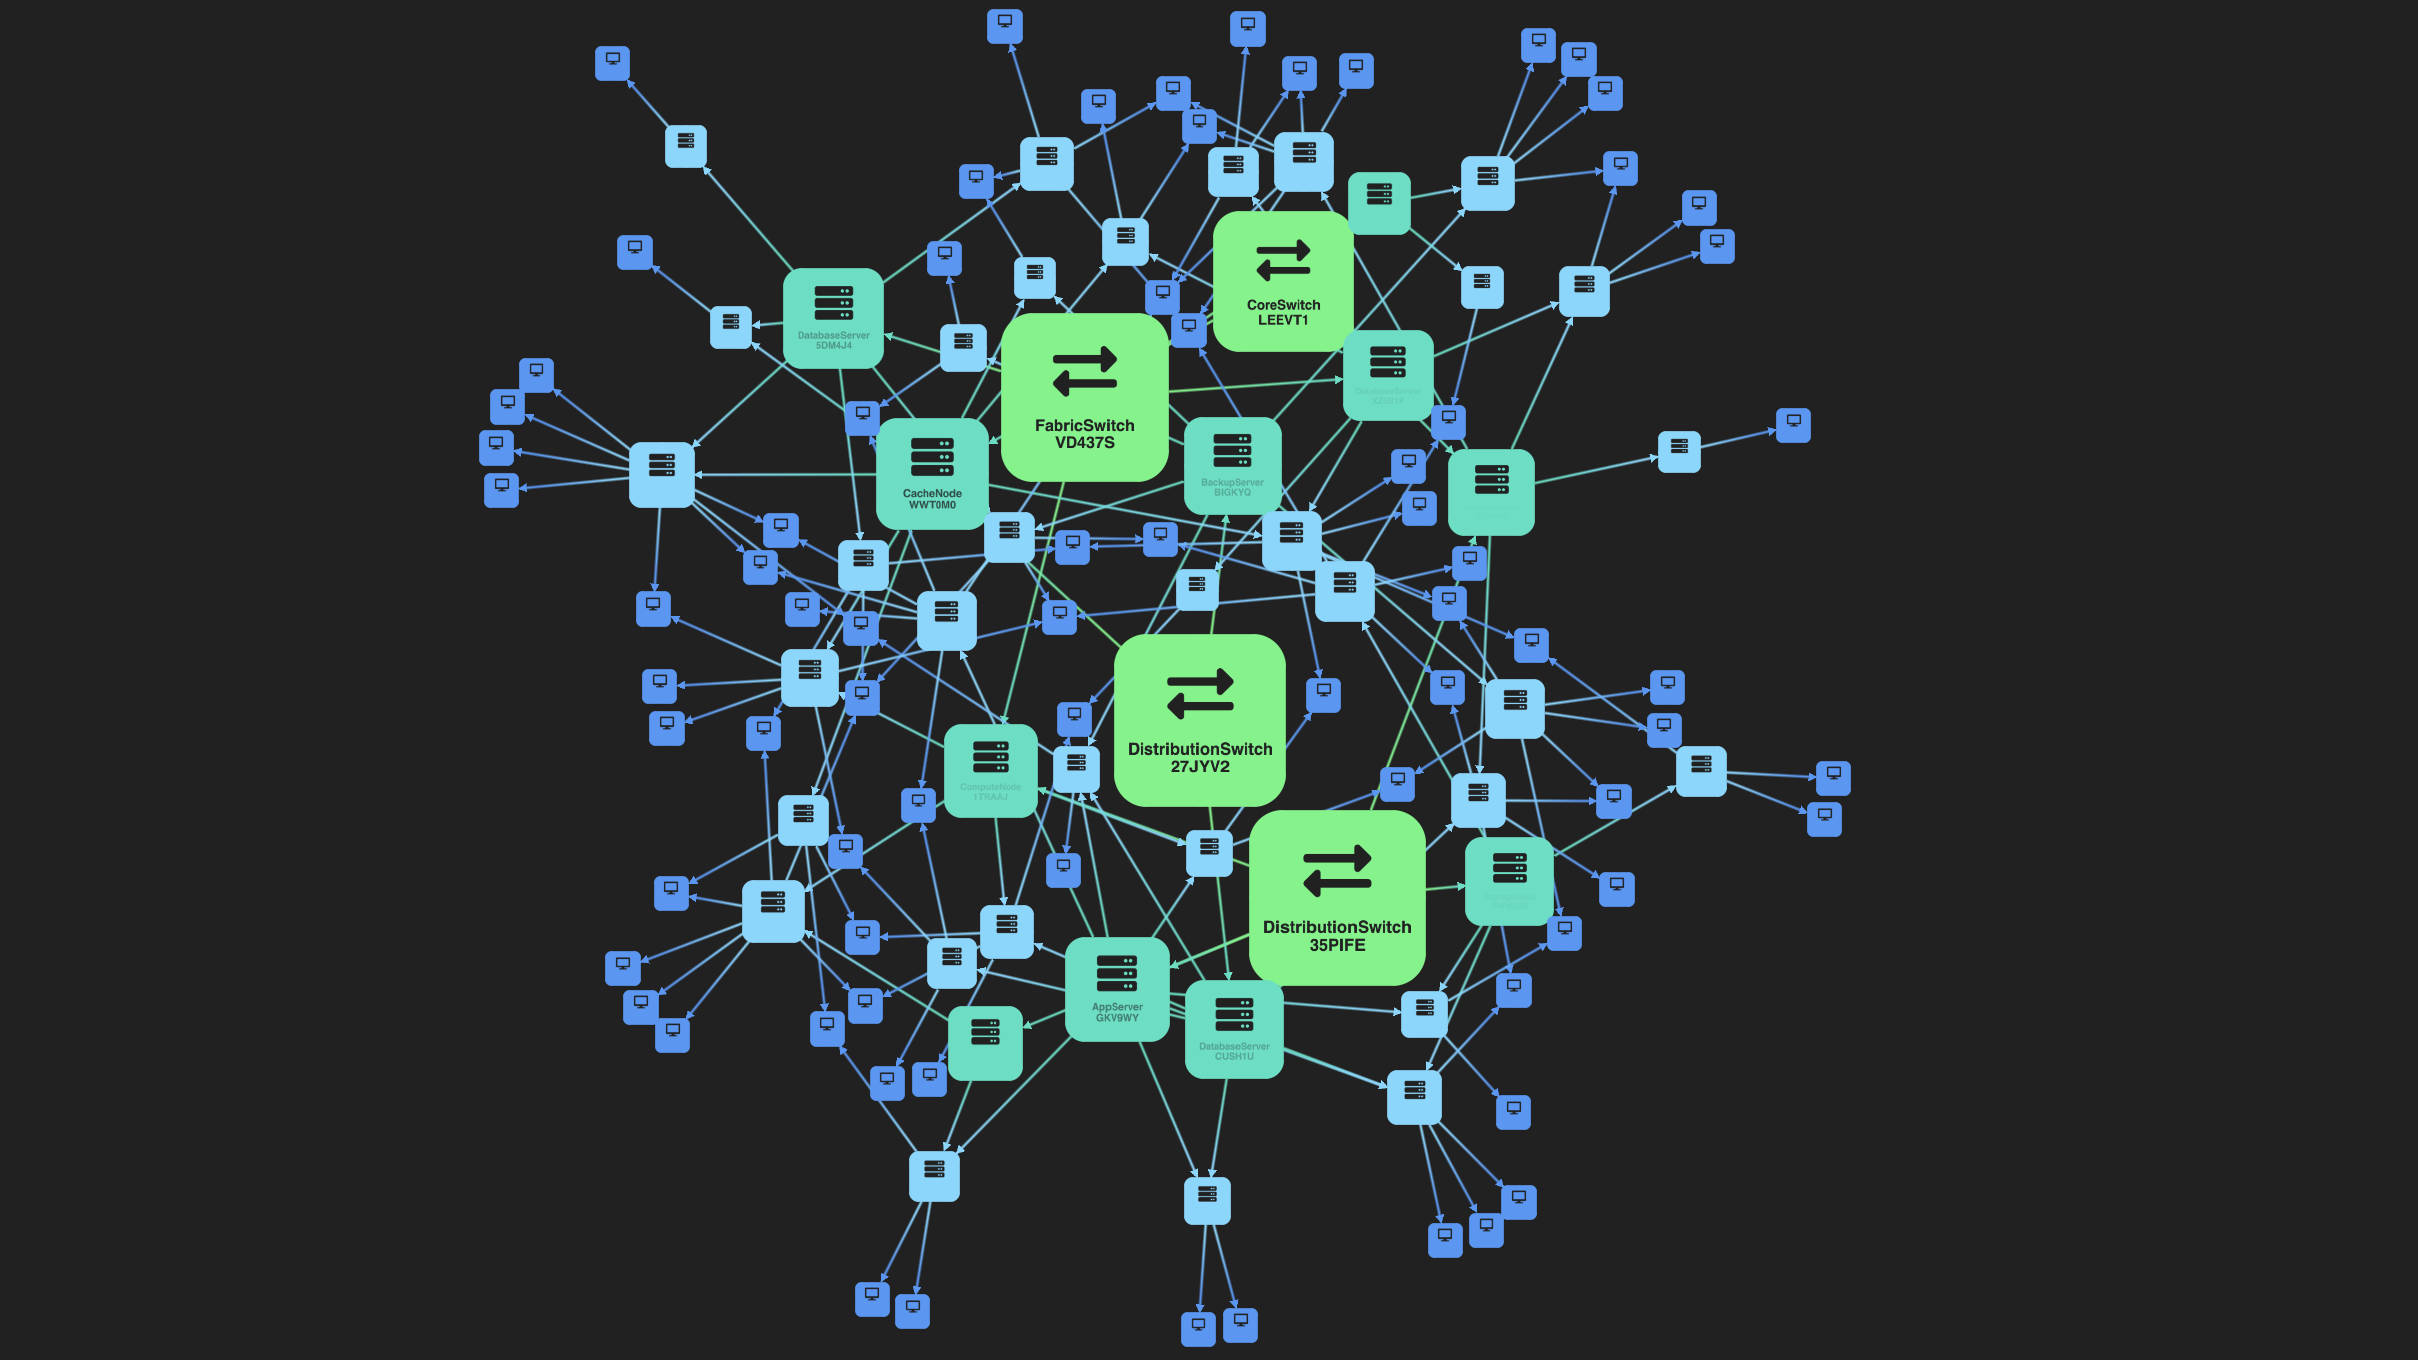
Trusted by leading organizations
From startups to Fortune 500s and governments building investigative apps in React.
Meet our customers


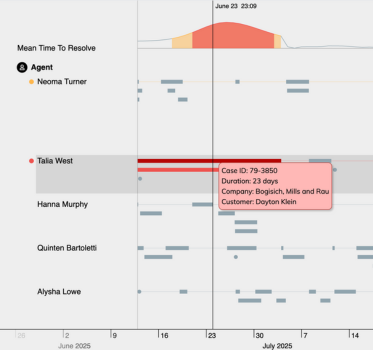
Integrating ReGraph into our intelligence platform took little effort. The added value of the graph and time bar visualization, on the other hand, is massive. Our customers love the additional possibilities, as they now have new views that improve their decision-making process.
What is ReGraph?
ReGraph is a React graph visualization SDK for exploring connected data at scale in modern web applications.
It integrates with MapWeave and KronoGraph for geospatial and time-based insights, with GPU-based rendering for scale, layouts, and social network analysis (SNA) metrics. Teams use ReGraph to deliver fast, intuitive network analysis experiences in React apps.
Download white paper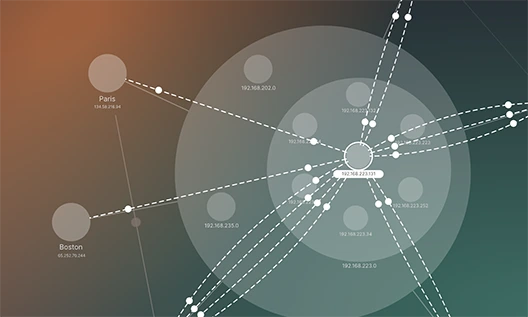
Why teams choose ReGraph?
Built for React
ReGraph works the React way. Its Chart and Time Bar components respond instantly to changes in your app’s state, with data and styling passed cleanly through props.
Developers stay in control of where data is stored and how components look and behave, all within familiar React patterns.
ReGraph provides a seamless way to build interactive graph visualization into React apps that run in any browser, on any device, and connect to any server or database.
High-performance visualization at any scale
ReGraph keeps your apps responsive whether you’re exploring just a few nodes or handling large graphs of connected entities.
Its GPU-based rendering, incremental updates, and automatic layouts ensure smooth performance as your data grows, even with large user bases.
Built on modern web technologies, it deploys easily to browsers everywhere, so you can deliver graph insight at enterprise scale.
A complete graph analysis toolkit
ReGraph gives you the building blocks to create graph visualization apps that match your data and your users’ needs.
Integrate with MapWeave and KronoGraph for geospatial and time-based insight, or apply layouts and social network analysis metrics for deeper investigation.
With cross-platform compatibility, clear documentation, and developer support, ReGraph helps you turn complex connected data into insights quickly.


Click a logo to find out more

Expert support from your first login
Every Cambridge Intelligence SDK comes with expert support from day one.
From onboarding to launch and beyond, our team is here to help you succeed.
First-line support comes directly from the developers who build our toolkits, backed by experts who can provide health checks, deep-dive workshops, and guidance tailored to ReGraph.
Try ReGraph for yourself
ReGraph’s advanced functionality
Frequently asked questions
What is ReGraph?
ReGraph is a React graph visualization SDK for building interactive network and link analysis web apps.
Who uses ReGraph?
It’s used by teams in cyber security, fraud detection, intelligence, and other fields that need to explore and analyze complex connected data.
How does ReGraph handle scale?
GPU-based rendering, incremental updates, tuned layouts, and interaction throttling allow you to explore large graphs of nodes and links smoothly.
Can I combine different views of my data?
Yes. You can filter by time with the Time Bar, plot entities on maps with Map Mode, and apply social network analysis metrics.
Which databases does ReGraph work with?
ReGraph is backend-agnostic and commonly used with Neo4j, Amazon Neptune, Cosmos DB, TigerGraph, JanusGraph, Elastic, and REST/GraphQL APIs.
How do I evaluate ReGraph?
Start a free trial to access the SDK site with demos, tutorials, and the full API reference.
From the blog
Ready to try ReGraph?
Start building your own graph visualization app with a free trial.